Kubernetes is a powerful platform for orchestrating containerized applications, offering scalability and flexibility. However, effectively monitoring a Kubernetes infrastructure is crucial for maintaining its health, identifying potential issues, and optimizing performance. Prometheus and Grafana are popular tools used in combination to monitor and visualize the Kubernetes ecosystem. In this blog post, we’ll explore how to set up Prometheus to scrape metrics from Kubernetes components and visualize these metrics using Grafana.
Understanding Prometheus and Grafana for Kubernetes monitoring
Prometheus:
Prometheus is an open-source monitoring system that collects and stores time-series data. It works based on a pull model, where it scrapes metrics from various targets (such as Kubernetes pods, nodes, services, etc.) using HTTP. Metrics in Prometheus are stored in a time-series database, allowing for powerful querying and alerting capabilities. Its query language, PromQL, enables users to gain deep insights into the collected data.
Prometheus’s main features are:
- a multi-dimensional data model with time series data identified by metric name and key/value pairs
- PromQL, a flexible query language to leverage this dimensionality
- no reliance on distributed storage; single server nodes are autonomous
- time series collection happens via a pull model over HTTP
- pushing time series is supported via an intermediary gateway
- targets are discovered via service discovery or static configuration
- multiple modes of graphing and dashboarding support
Prometheus’s architecture
This diagram illustrates the architecture of Prometheus and some of its ecosystem components:
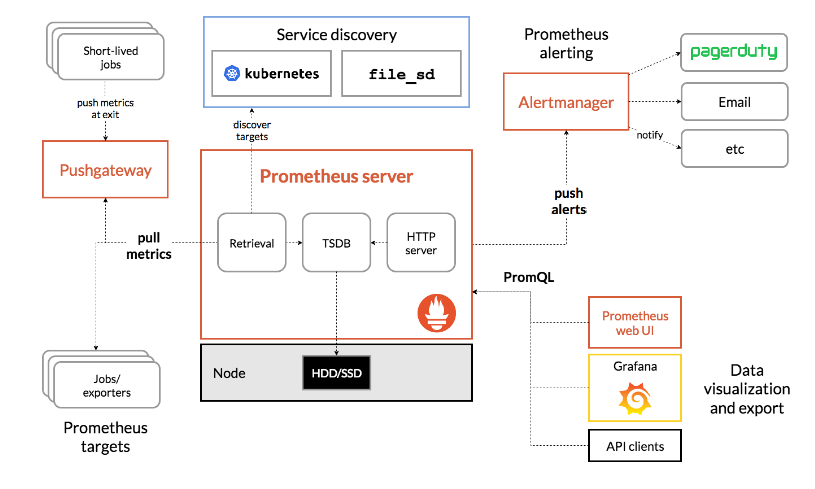
The Prometheus ecosystem consists of multiple components, many of which are optional:
- the main Prometheus server which scrapes and stores time series data
- client libraries for instrumenting application code
- a push gateway for supporting short-lived jobs
- special-purpose exporters for services like HAProxy, StatsD, Graphite, etc.
- an alertmanager to handle alerts
- various support tools
Where does prometheus fit?
Prometheus works well for recording any purely numeric time series. It fits both machine-centric monitoring as well as monitoring of highly dynamic service-oriented architectures. In a world of microservices, its support for multi-dimensional data collection and querying is a particular strength.
Prometheus is designed for reliability, to be the system you go to during an outage to allow you to quickly diagnose problems. Each Prometheus server is standalone, not depending on network storage or other remote services. You can rely on it when other parts of your infrastructure are broken, and you do not need to setup extensive infrastructure to use it.
Grafana:
Grafana is an open-source analytics and visualization platform. It allows users to create and customize dashboards, displaying data from various data sources, including Prometheus. Grafana provides powerful visualization tools, such as graphs, charts, and alerts, making it an excellent companion to Prometheus for monitoring Kubernetes.
Prerequisites
Before diving into setting up Prometheus and Grafana, ensure you have the following prerequisites in place:
- Basic knowledge on kubernetes
- A running Kubernetes cluster
- kubectl command-line tool installed
- Helm package manager for Kubernetes
- Basic understanding of YAML and Kubernetes manifests
- Access to deploy resources in the cluster
Deploying Prometheus and Grafana using Helm charts
Now we will deploy Prometheus on a Kubernetes cluster using Helm charts:
Firstly, we will add the helm repository which is required then we will update the repository
helm repo add stable https://charts.helm.sh/stable
helm repo add prometheus-community https://prometheus-community.github.io/helm-charts
helm repo update
You can then run helm search repo prometheus-community to see the charts.
helm search repo prometheus-community
Let’s install the Prometheus chart. You can find more details about this chart here
helm install prometheus prometheus-community/kube-prometheus-stack
Now check the deployment status
kubectl get pods -l "release=prometheus"
This chart will install additional charts as well:
- Node-exporter on all the three nodes which are in your cluster
- Grafana
- Prometheus
- Alert Manager
- Operator
- Kube State Metrics
Now you have Prometheus installed with the bundle of components required to operate it on a Kubernetes environment.
Access the Prometheus and Grafana on the browser
Now we will set an NGINX ingress controller to access Prometheus and Grafana from the browser.
Apply the following command in your k8s cluster
kubectl apply -f https://raw.githubusercontent.com/kubernetes/ingress-nginx/controller-v1.8.2/deploy/static/provider/cloud/deploy.yaml
It will install the NGINX ingress in our cluster. Now we have to set rules for accessing Prometheus and Grafana.
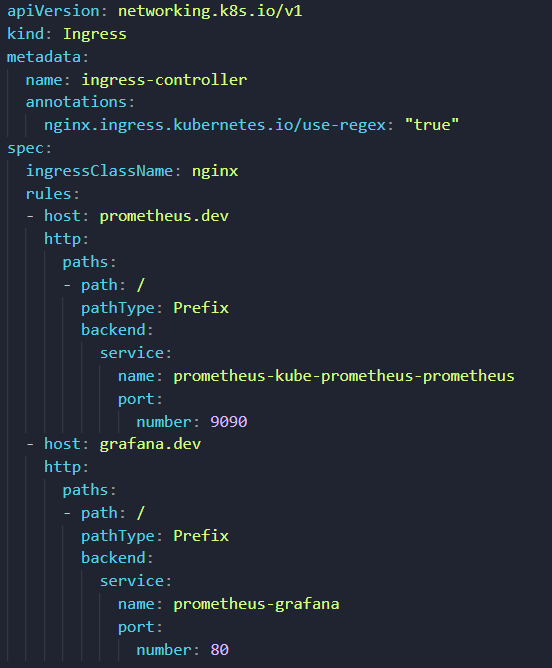
The above rules are an example of how can we set up rules for Prometheus and Grafana. Make sure you have added promethus.dev and grafana.dev in your local host’s file or your DNS. The service name and ports, you will find it from by running kubetctl get all commands
Access Promethus
If you hit promethus.dev url, you can see the Prometheus web ui panel like the below image
These are targets that the prometheus server is scraping data.
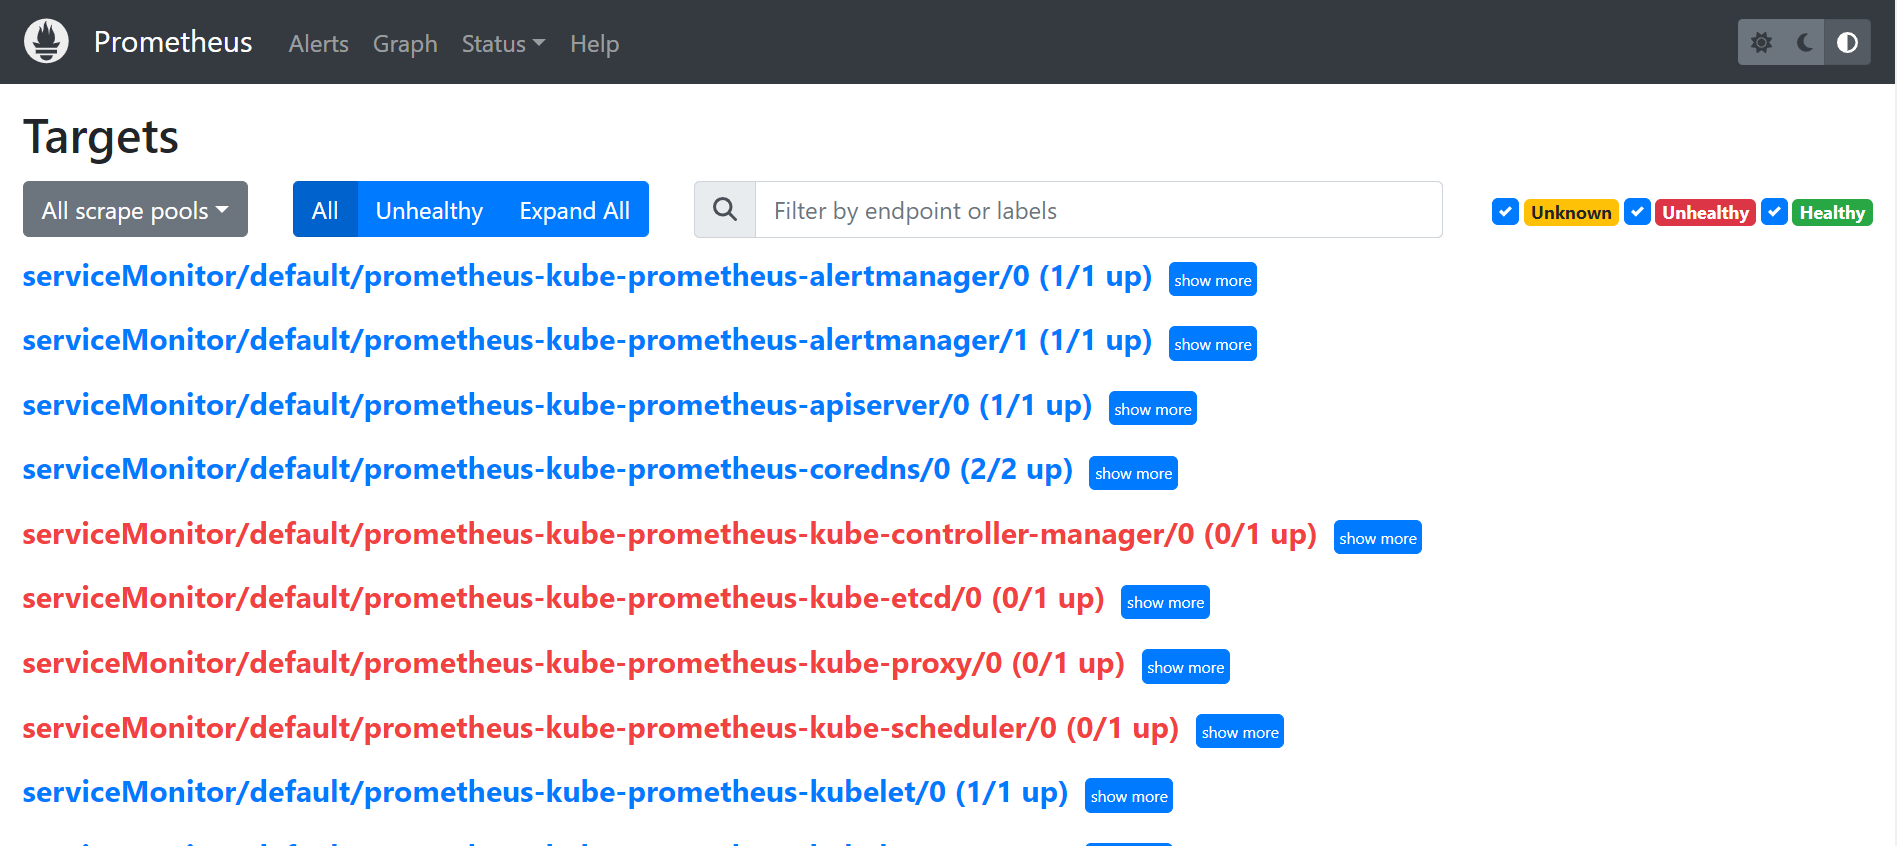
Prometheus gives the metrics in a text format that is hard to understand, To see the metrics more beautifully we will use Grafana.
Access Grafana
Hit grafana.dev in your browser. You have to log in to Grafana. The default username and password is admin and prom-operator.
Once you are able to login to Grafana successfully you can try exploring using the default dashboard which is provided by Grafana. With the helm chart, the Prometheus data source will be added by default. Now we will create a dashboard that shows us all the pod details like CPU, memory, storage, etc. Grafana provides a lot of dashboards that we can directly import into our Grafana instance and use it. In this example, we will use this dashboard
Import the dashboard
Click onClick on + icon -> Import and then save it
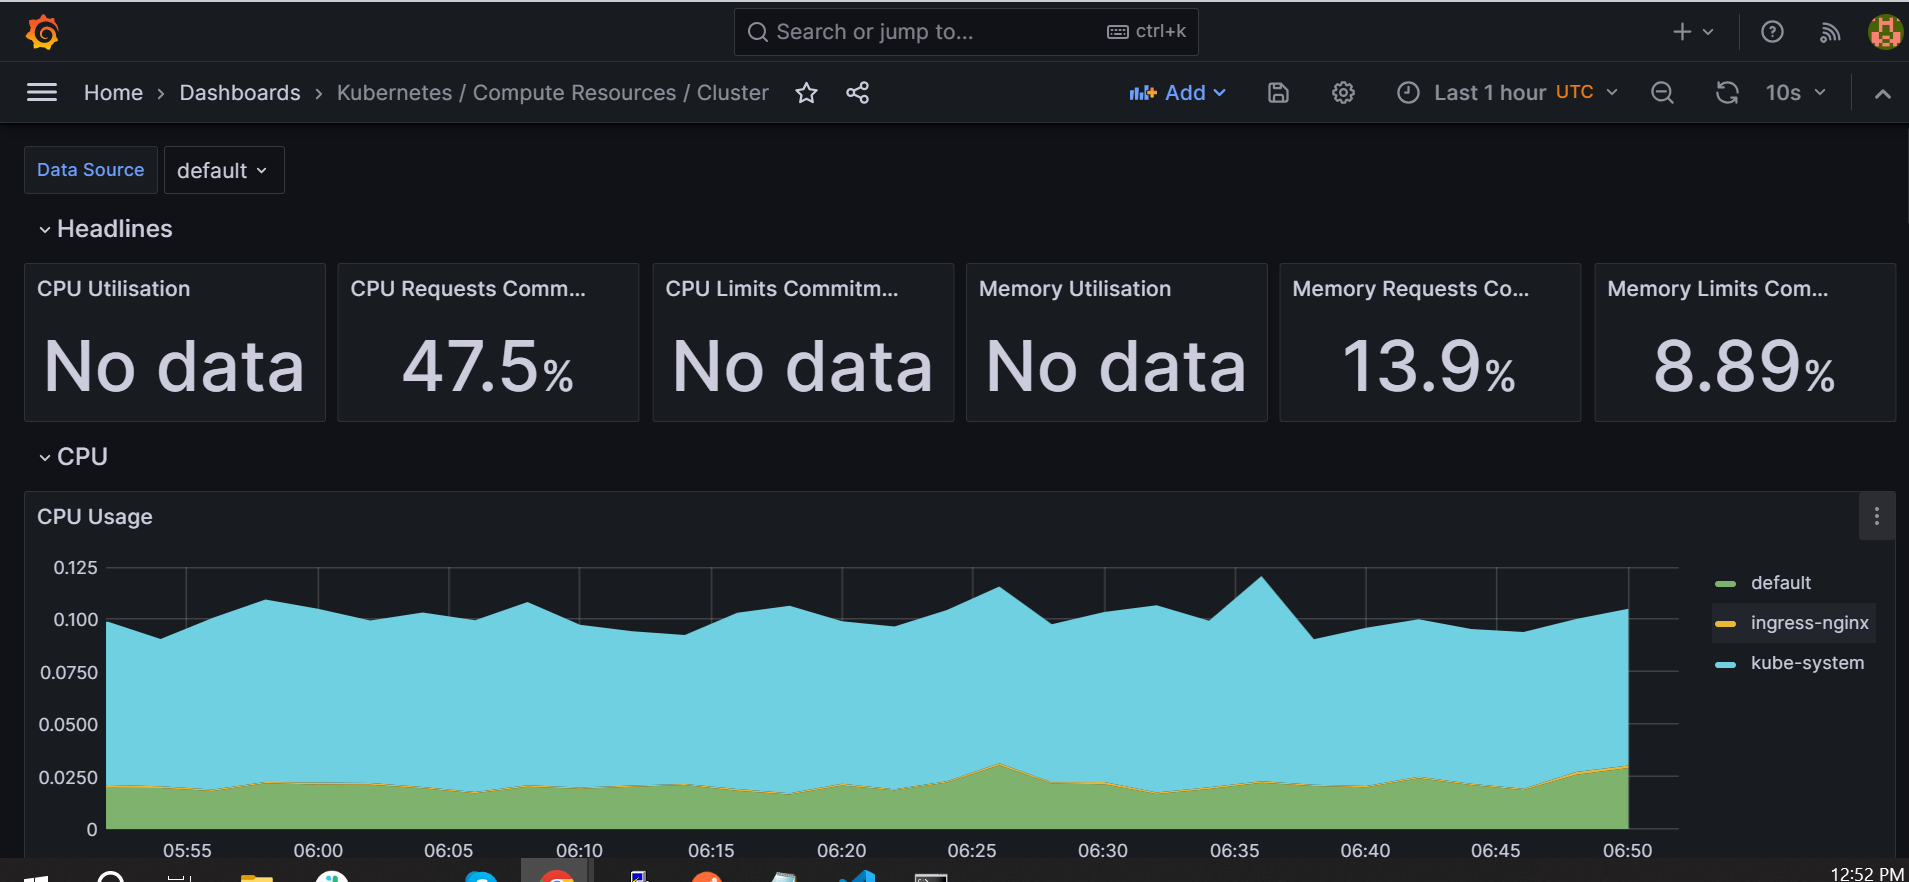
This is how the dashboard will look like and provide all the metrics for your pods. You can now monitor all of your infra resources with a beautiful look.
Cluster Monitoring:
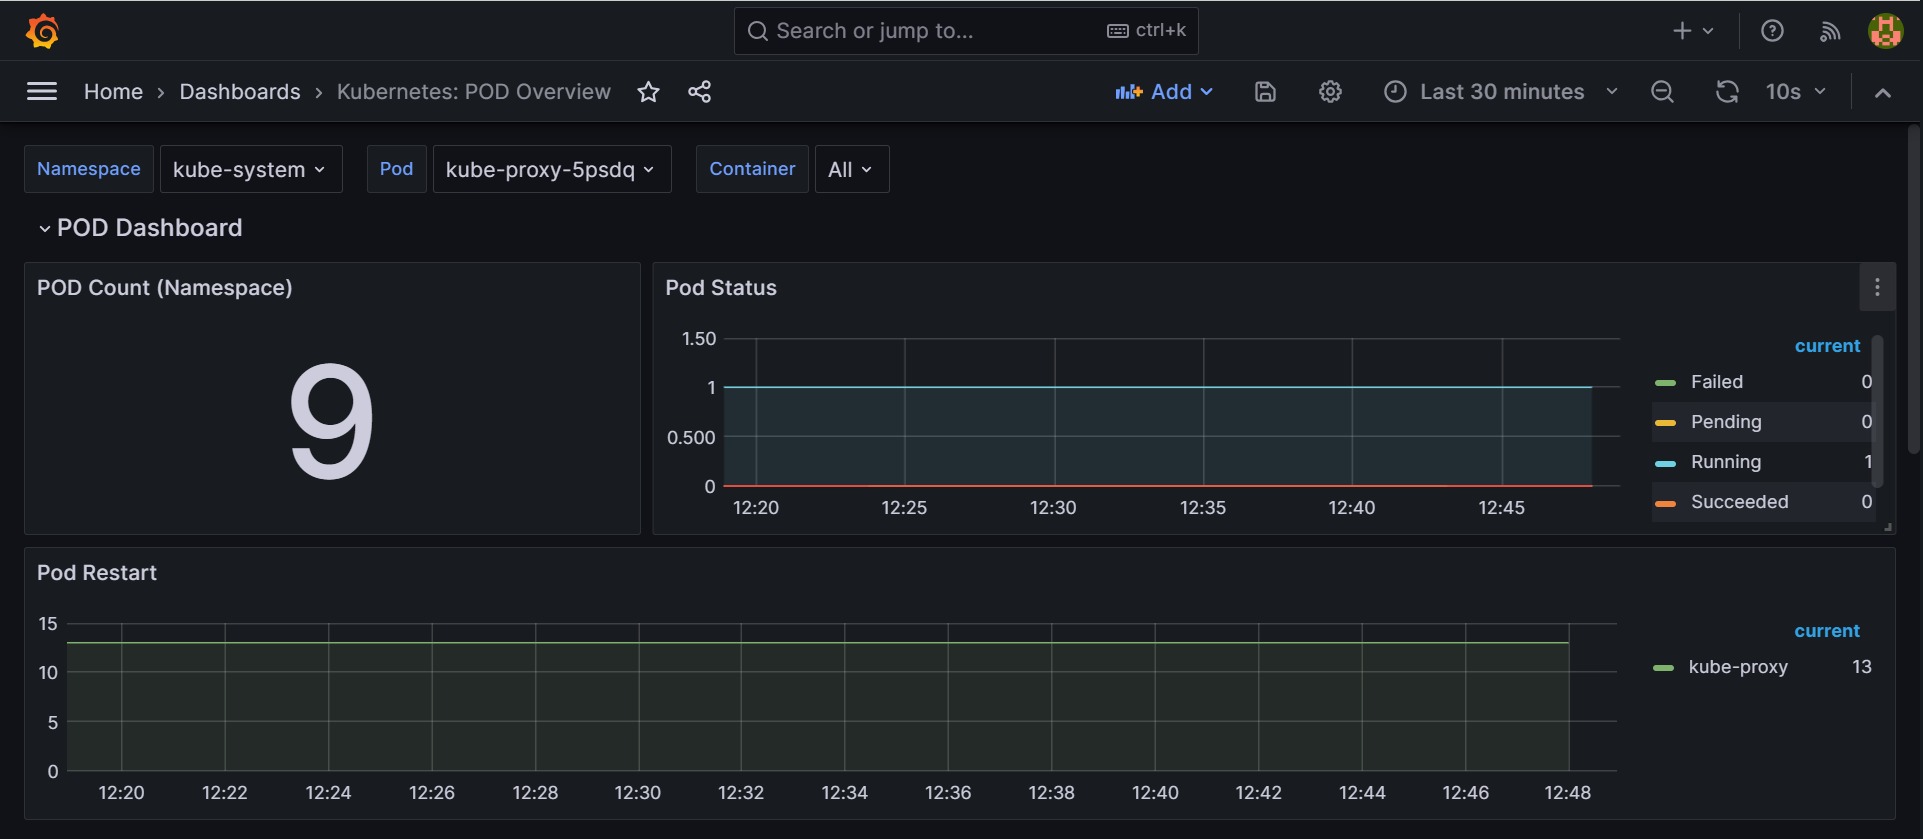
Pod monitoring:
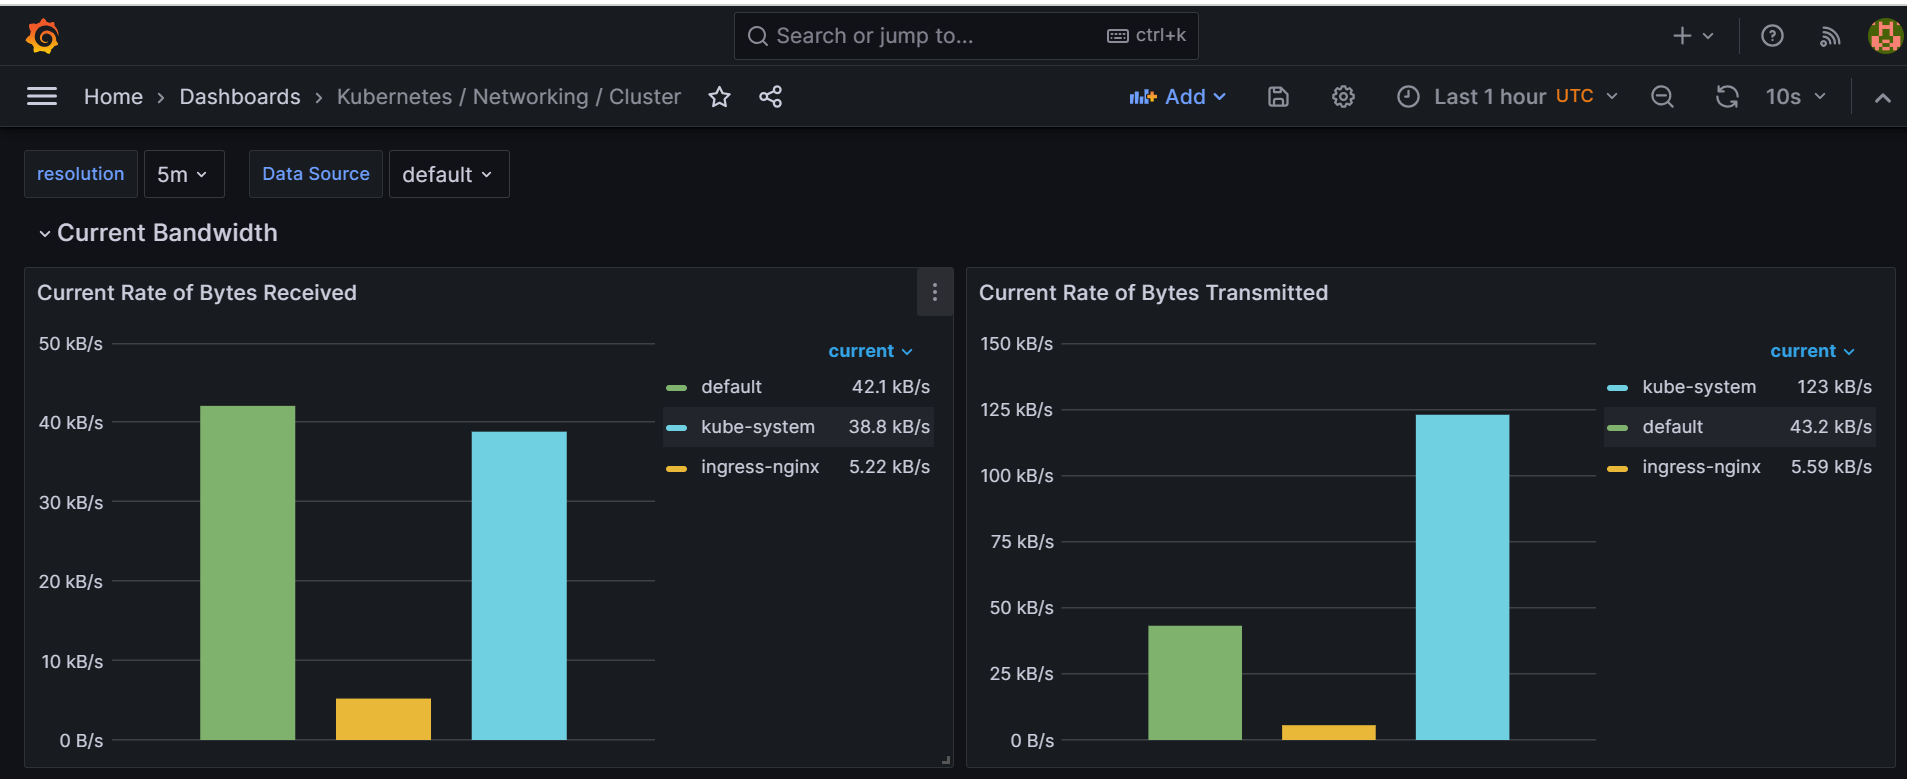
Network monitoring:
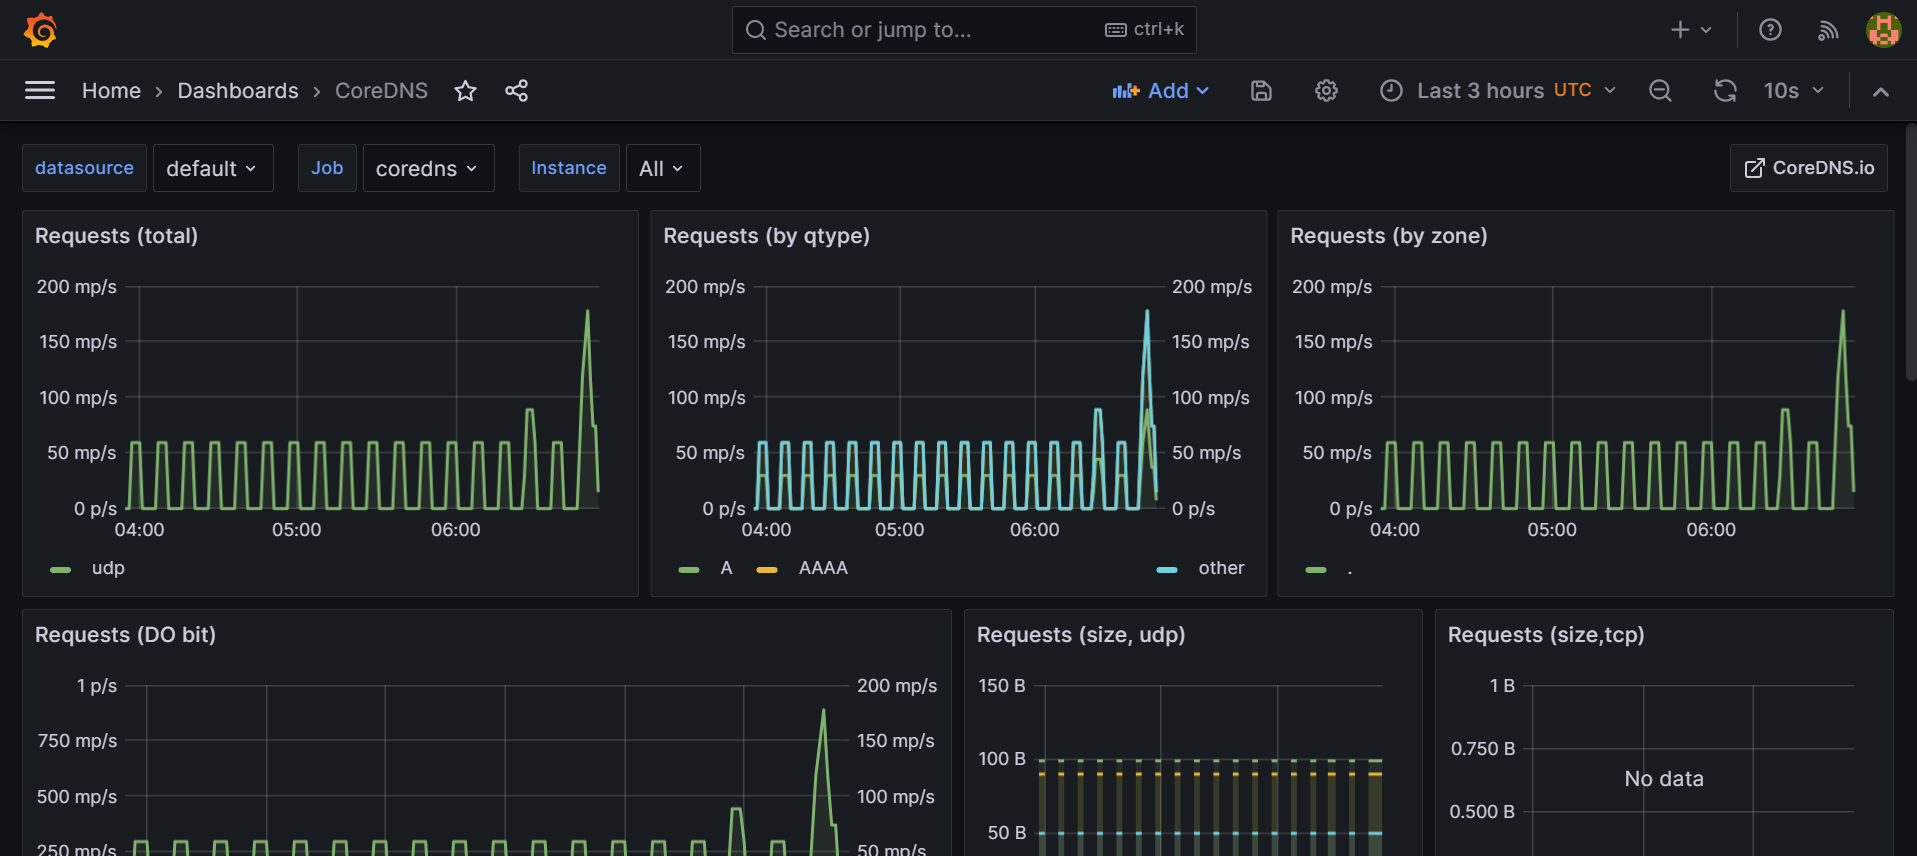
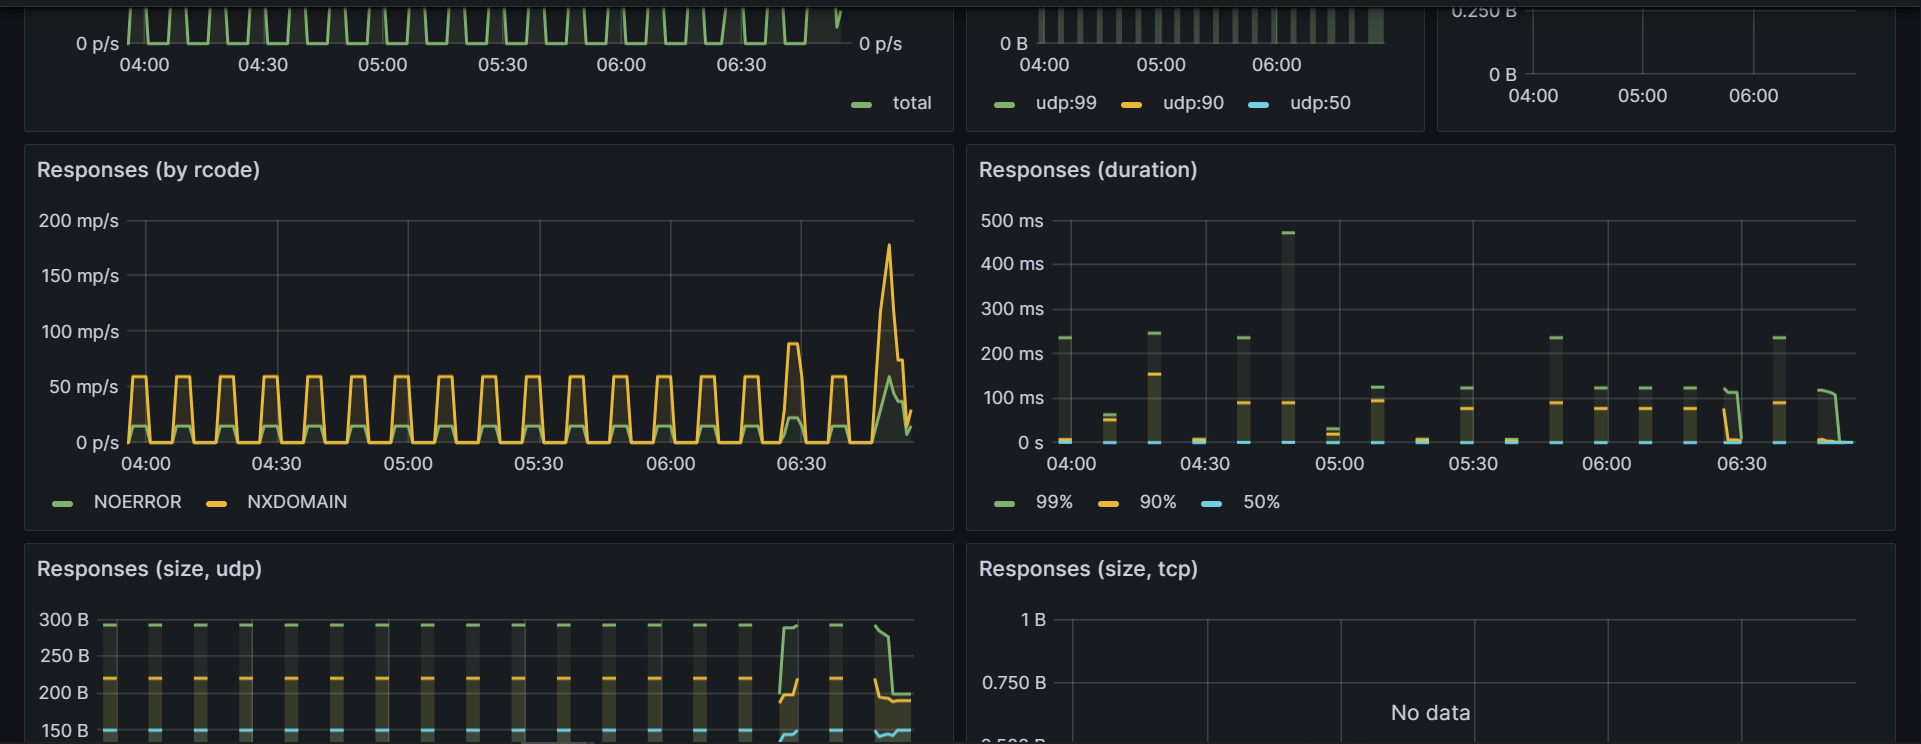
DNS monitoring:
Conclusion
In this blog, we’ve covered the basics of setting up Prometheus and Grafana to monitor a Kubernetes infrastructure. Understanding how to deploy and configure these tools is the first step towards gaining deeper insights into your Kubernetes cluster’s performance and health. As you become more familiar with Prometheus and Grafana, you can explore advanced configurations, create custom dashboards, and set up alerts to effectively monitor and manage your Kubernetes environment. Regular monitoring and analysis will help you ensure optimal performance, troubleshoot issues, and maintain the health of your Kubernetes infrastructure.
At iXora, we provide a highly qualified, dynamic DevOps team at your service. Feel free to contact us.
Add a Comment